


Petrol Price India Chart is something every vehicle owner and commuter keeps an eye on. In India, petrol prices change almost daily, influenced by global crude oil costs, taxes, and currency exchange rates. Tracking the petrol price cycle helps you understand when rates might rise or fall, while the petrol price India graph and India petrol price history give a clear picture of long-term trends. Whether you want to see daily prices or explore Indian petrol price history, having this data at your fingertips can help you plan travel expenses and manage your budget more effectively.
Petrol Price India Chart – State-Wise Rates
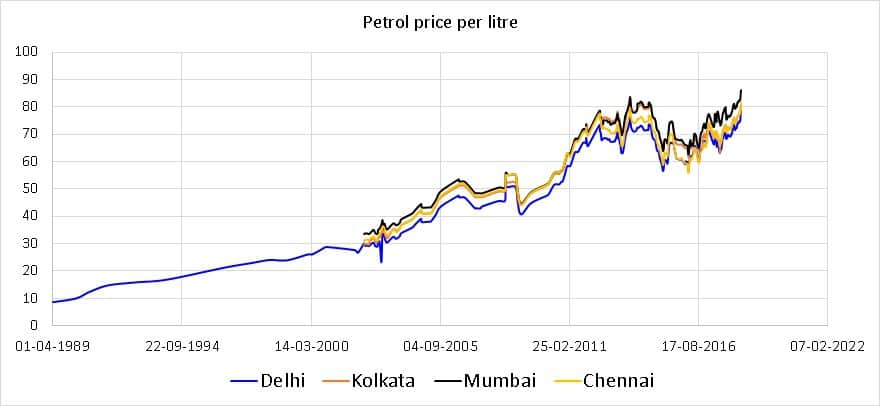
Petrol prices in India vary from state to state due to differences in VAT, local taxes, and transportation costs. Keeping track of the petrol prices chart helps you understand the rate in your city compared to others. The petrol price in India graph and petrol price history in India show how prices have moved over time, helping you spot patterns in the price of petrol in India for last 10 years.

Below is the state-wise Petrol Price India Chart with current rates. These prices are updated regularly, but they may differ slightly depending on the fuel station.
State / UT | Petrol Price (₹/Litre) |
Delhi | ₹96.72 |
Mumbai | ₹106.31 |
Chennai | ₹102.74 |
Kolkata | ₹106.03 |
Bengaluru | ₹101.94 |
Hyderabad | ₹109.66 |
Pune | ₹106.12 |
Jaipur | ₹108.48 |
Chandigarh | ₹96.20 |
Patna | ₹107.24 |
You can also track the petrol price in India last 10 years through a petrol price graph for better insights into historical trends.
Petrol Prices in India (2004–2024)
Tracking the petrol price year wise helps you understand how fuel costs have evolved over the years. The petrol price graph in India and petrol price chart provide a clear picture of fluctuations, especially in the last decade. Below is the petrol price in India year wise list that reflects the petrol price in India in last 10 years and beyond, making it easier to compare with past records such as 2014 petrol price in India.
Year | Average Petrol Price (₹/Litre) |
2004 | ₹36.81 |
2005 | ₹39.25 |
2006 | ₹42.85 |
2007 | ₹43.52 |
2008 | ₹50.62 |
2009 | ₹44.72 |
2010 | ₹51.72 |
2011 | ₹63.15 |
2012 | ₹67.24 |
2013 | ₹71.13 |
2014 | ₹72.26 |
2015 | ₹61.20 |
2016 | ₹64.00 |
2017 | ₹68.42 |
2018 | ₹76.73 |
2019 | ₹74.19 |
2020 | ₹72.00 |
2021 | ₹96.00 |
2022 | ₹105.41 |
2023 | ₹96.72 |
2024 | ₹96.72 (Current Avg.) |
With this petrol price history India table, you can create an India petrol price graph to visualize trends and see how petrol prices graph changed year by year.
State and Central Taxes on Fuel (2004–2024)
When looking at petrol price in India history, one of the biggest factors that stands out is taxation. Both state and central governments levy taxes on fuel, which together form a major share of the retail selling price. Over the years, these taxes have significantly influenced the petrol price cycle, making them a key part of the India petrol price history.
If you see the petrol price India chart or petrol price India graph, you’ll notice that during the last decade, the share of taxes has steadily increased. While state taxes vary from one region to another, the central excise duty is uniform across the country. This steady rise in taxes explains why petrol price last 10 years India shows a consistent upward trend despite fluctuations in crude oil prices.
Table: State and Central Taxes on Petrol in India (2004–2024)
Year | State Taxes (₹/litre) | Central Taxes (₹/litre) | Total Taxes (₹/litre) |
2004 | 8.50 | 5.00 | 13.50 |
2005 | 8.70 | 5.10 | 13.80 |
2006 | 8.90 | 5.20 | 14.10 |
2007 | 9.10 | 5.40 | 14.50 |
2008 | 9.50 | 5.80 | 15.30 |
2009 | 9.80 | 6.00 | 15.80 |
2010 | 10.00 | 6.50 | 16.50 |
2011 | 10.50 | 7.00 | 17.50 |
2012 | 10.80 | 7.20 | 18.00 |
2013 | 11.00 | 7.50 | 18.50 |
2014 | 11.50 | 8.00 | 19.50 |
2015 | 12.00 | 8.50 | 20.50 |
2016 | 12.50 | 9.00 | 21.50 |
2017 | 13.00 | 9.50 | 22.50 |
2018 | 13.50 | 10.00 | 23.50 |
2019 | 14.00 | 10.50 | 24.50 |
2020 | 14.50 | 12.00 | 26.50 |
2021 | 15.00 | 13.00 | 28.00 |
2022 | 14.80 | 12.50 | 27.30 |
2023 | 14.50 | 12.00 | 26.50 |
2024 | 14.20 | 11.80 | 26.00 |
Over time, higher taxation has made fuel prices less dependent on international crude oil variations. This trend, clearly visible in petrol price in India last 10 years, is a reminder of how policy decisions impact everyday costs for consumers.

Impact of Petrol Price Changes
- Long-term trend visible in India petrol price history: Over time, the petrol price cycle shows a steady rise in rates due to crude oil fluctuations, currency value, and taxation.
- Everyday expenses directly affected: Increases in fuel prices raise transportation costs, which impacts food delivery, commuting, and essential goods pricing.
- Indian petrol price history shows economic impact: Higher petrol costs often lead to inflation, as industries like transport, agriculture, and manufacturing pass on costs to consumers.
- Petrol prices chart & petrol price in India graph reveal patterns: By reviewing petrol price in India year wise, you can spot trends and anticipate future changes.
- Price of petrol in India for last 10 years remains high despite crude oil dips: This is due to stable or rising state and central taxes even when global oil prices fall.
- Petrol price history in India helps in budgeting: Regular tracking of petrol price in India in last 10 years and petrol price graph in India aids individuals and businesses in financial planning.
Best Fuel Credit Cards In India 2025
Tips to Save on Petrol Expenses
Petrol prices have seen major changes over the years — from the 2014 petrol price in India to the 2016 petrol price in India, and even the petrol price in 2018, the upward petrol price trend in India has impacted every household. Whether you check the historical petrol prices or the all India petrol price list, fuel has become a significant expense. Here are some smart ways to reduce your petrol spending:
- Drive Smoothly – Avoid sudden braking or rapid acceleration. This not only saves petrol but also keeps your car in better condition.
- Maintain Your Vehicle – Regular servicing ensures the engine runs efficiently, lowering fuel consumption.
- Plan Your Trips – Combine errands in one outing to reduce unnecessary travel.
- Use Public Transport When Possible – In cities where fuel costs are high, buses, metros, or ride-sharing can help.
- Check Petrol Prices Before Filling – Keep an eye on the petrol price in India list to buy fuel when it’s cheaper in your area.
- Lighten the Load – Extra weight in your vehicle increases fuel usage.
- Avoid Idling – Turn off your engine if you’re stopping for more than a minute.
From the 2017 petrol price in India to today’s rates, the cost difference is clear — small savings every day can make a big difference over time.
Latest Petrol Price Updates in India (2025)
Keeping up with the latest petrol price in India is important for every consumer and business. Petrol prices in India are updated daily at 6 a.m., reflecting global crude oil rates, taxes, and government regulations—thanks to the dynamic pricing system introduced in 2017.
Petrol Price Trend Across Major Cities (August 11, 2025)
- New Delhi: ₹94.72 per litre
- Mumbai: ₹104.21 per litre
- Bangalore: ₹99.84 per litre
- Chennai: ₹100.85 per litre
- Hyderabad: ₹107.41 per litre
- Kolkata: ₹103.94 per litre
- Karnataka (state average): ₹100.28 per litre
Most cities have seen very stable rates this month with minimal fluctuations. Karnataka’s petrol price has consistently remained around ₹100.28 per litre throughout August, while Hyderabad currently records the highest metro price. Itanagar has the lowest among state capitals.
India Petrol Price Chart 2025
City | Price (₹/Litre) |
New Delhi | 94.72 |
Mumbai | 104.21 |
Bangalore | 99.84 |
Chennai | 100.85 |
Hyderabad | 107.41 |
Kolkata | 103.94 |
Karnataka Avg | 100.28 |
Petrol Price Trends in India 2025
- Petrol prices are showing modest decreases in some states compared to previous months but remain overall steady.
- Daily revision ensures transparency and aligns domestic rates with international pricing.
- Some states like Andhra Pradesh and Telangana see higher rates due to local taxes, while cities like Itanagar enjoy lower prices.
- The highest recorded price in Karnataka for August 2025 was ₹104.15, with a slight decrease towards the end of the month
Petrol price in India since 1947 to 2023 Today
Tracking the petrol price in India since 1947 to 2018 and beyond helps us understand how the petrol price hike in India graph has evolved. Below is a petrol price in India from 2000 to 2021 along with key historical milestones, including the 2013 petrol price in India, the petrol price in India 2020, and other important years.
Year | Petrol Price (₹/litre) | Remarks |
1947 | 0.27 | Post-independence rate |
1950 | 0.49 | Stable economy phase |
1960 | 0.71 | Gradual increase |
1970 | 1.80 | First oil crisis |
1980 | 3.10 | Global oil price rise |
1990 | 8.00 | Economic reforms beginning |
2000 | 26.00 | Liberalisation effects |
2005 | 40.49 | Global crude hike |
2010 | 47.12 | Deregulation of petrol prices |
2013 | 73.16 | Highest till date at the time |
2016 | 59.20 | Drop due to global crude price fall |
2018 | 84.00 | Peak in petrol price in India since 1947 to 2018 |
2020 | 74.63 | Pandemic-led demand fall |
2021 | 101.84 | First time crossing ₹100 mark |
2022 | 105.41 | Global crude surge post-COVID |
2023 | 96.72 | Slight correction in rates |
What was the highest petrol price in India?
The highest petrol price in India crossed ₹110 per litre in 2022 due to global crude oil surges.
What is the current 1 litre petrol price in India?
The 1 litre petrol price in India varies by state due to different tax rates.
What is the all India petrol price today?
The all India petrol price ranges from ₹95 to ₹110 per litre depending on the city.

What was the petrol price in 2008 in India?
In 2008, petrol price in India averaged around ₹50 per litre due to rising crude costs.
What was the petrol price in 2010 in India?
The petrol price in 2010 in India was approximately ₹47.12 per litre after deregulation.
What was the petrol price in 2017 in India?
The petrol price in 2017 in India ranged between ₹66 and ₹70 per litre.
What was the petrol rate in India in 2016?
The petrol rate in India in 2016 averaged around ₹59.20 per litre.
What was the petrol price in 2014 in India?
In 2014, petrol price in India hovered around ₹72.26 per litre before global crude prices fell.
Trending Credit Cards In India July 2025


Add Comment